The Art of Prediction: How Math Reads the Future
Since the dawn of time, humans have tried to predict the future. We used to look at the stars or consult oracles. Today, we have a much more powerful tool: Regression Analysis. This is the mathematical engine behind everything from stock market predictions to Artificial Intelligence. It is the art of finding the hidden relationship between cause and effect.
Visualizing the Chaos
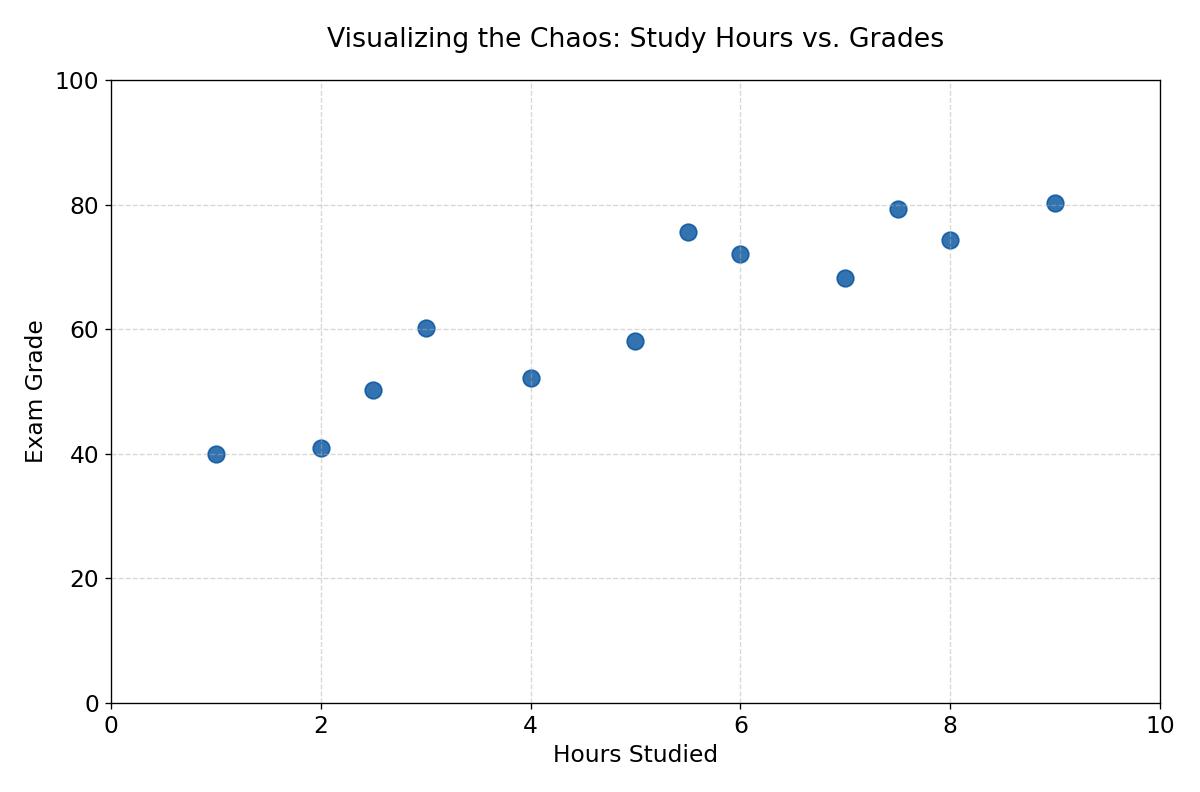
Imagine you want to answer a simple question: 'Does studying more actually improve grades?' You walk into a classroom and ask 10 students two questions: how many hours they studied, and what grade they got.
If you plot these points on a graph, you won't get a straight line. You get a cloud of dots. Some students studied little and got lucky; others studied hard but panicked. This 'cloud' represents the chaos of the real world. To the untrained eye, it looks random. To a mathematician, it's a puzzle waiting to be solved.
The Crystal Ball: The Line of Best Fit
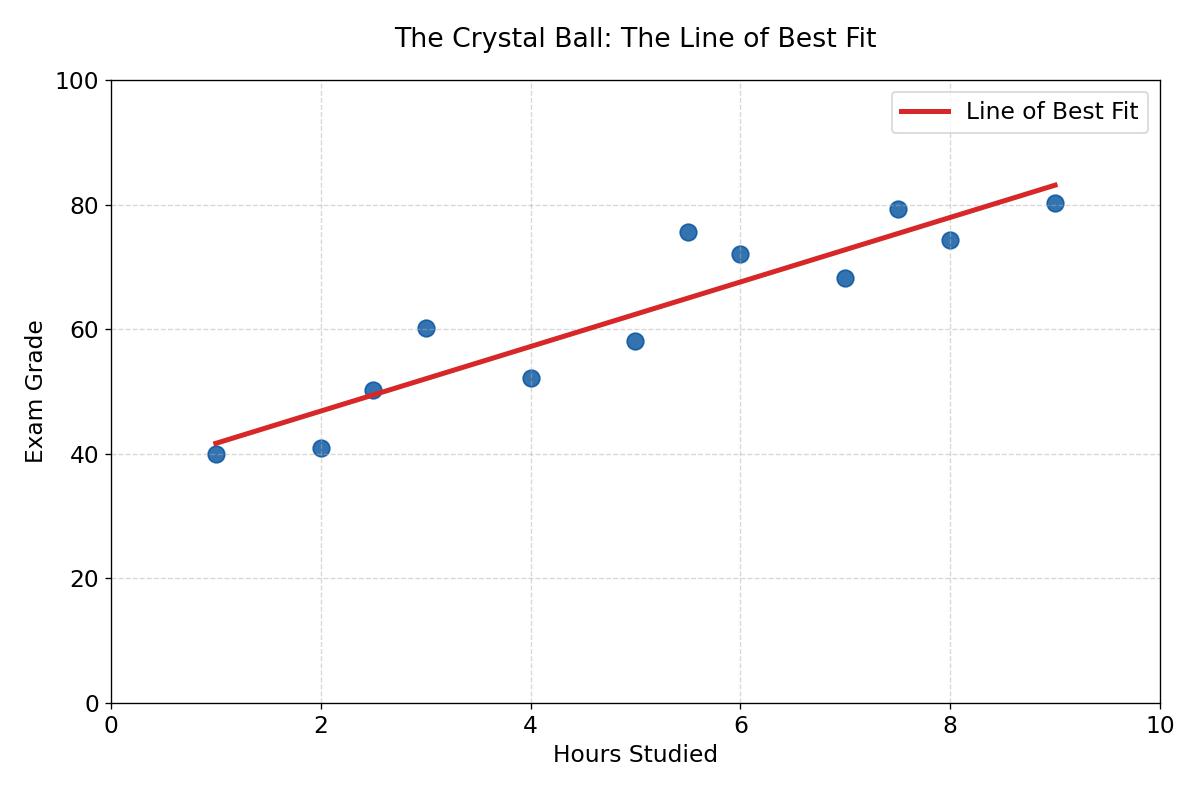
Our goal is to draw a single straight line through this cloud that best represents the 'trend.' This is the Line of Best Fit. In high school, you know this as:
y = mx + c (or y = a + bx in University)
This isn't just a line. It's a prediction machine. Once we have this line, we can look at a student who studied for 5 hours and predict their grade, even if we've never met them before. The 'slope' (b) tells us the magic number: for every extra hour of study, how many extra points do you gain?
The Rubber Band Theory (Least Squares)
But how do we choose exactly where to put the line? Why not a little higher? A little steeper?
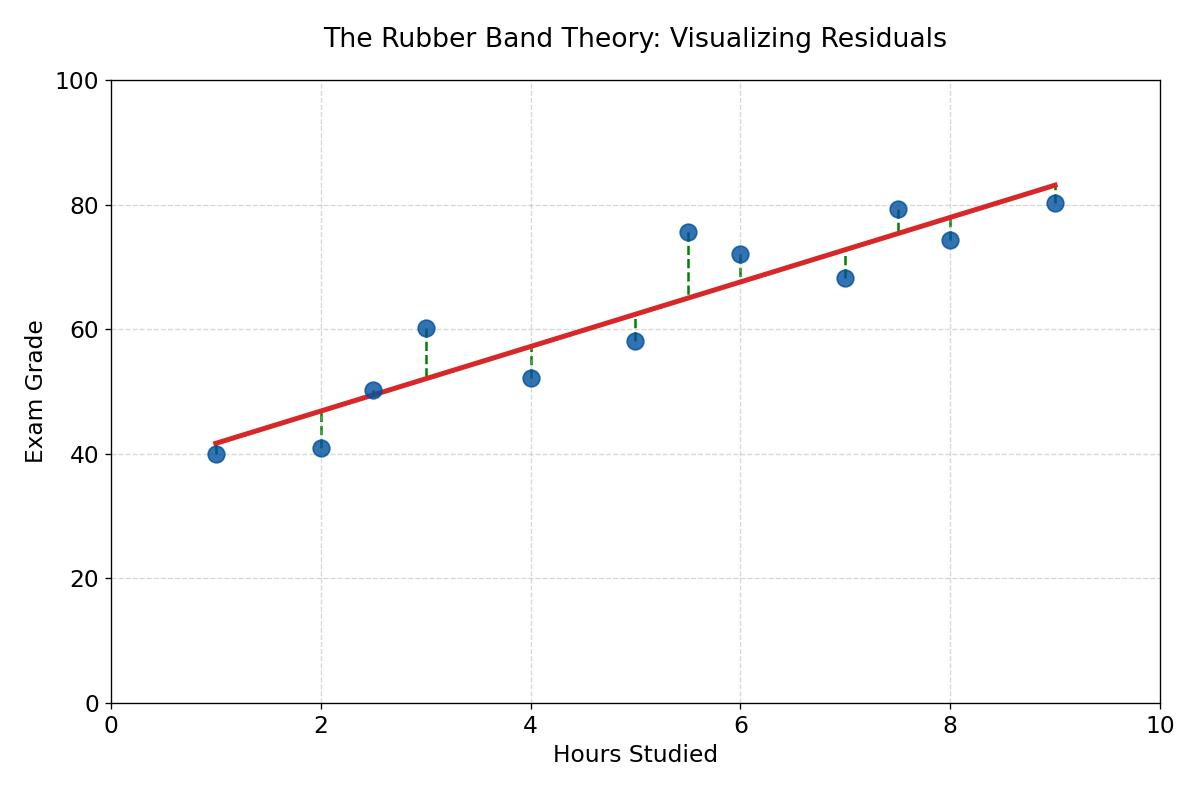
Imagine that every dot on the graph is connected to the line by a vertical rubber band. The dots pull the line toward them. The line settles exactly where the tension from all the rubber bands is balanced.
In mathematics, this is called the Method of Ordinary Least Squares (OLS). We measure the distance from every dot to the line (the 'error' or 'residual'), square those distances to make them positive, and try to make the total sum as small as possible. The line that misses everyone by the least amount is the winner.
From Grades to Wall Street
This simple concept—drawing a line through data—is the foundation of Econometrics. It is how financial directors predict next year's revenue based on marketing spend. It is how real estate algorithms estimate the price of a house based on its square meters.
However, the most important lesson in regression is this: Correlation does not imply Causation. Just because two things move together (like ice cream sales and shark attacks) doesn't mean one causes the other. A true mathematician learns to interpret the data, not just calculate it.
The Power of Analytics
Regression Analysis is the bridge between raw data and actionable wisdom. Whether you are an IB student analyzing a physics experiment or a university student building a financial model, mastering this tool gives you the power to see the invisible trends that shape our world.